Free sample of the book: the prologue and the first five chapters
 By José Luis Rodríguez Author of ORDER FLOW — Market Mechanics
The opening of the book exactly as printed: the same text, the same charts and the full table of contents. As a PDF, with no sign-up.

What it contains
Besides the book's full table of contents, the sample includes the prologue and chapters 1 to 5 in full, covering Parts I and II and the first chapter of Part III:
- Prologue: When Technical Analysis Stops Working
-
Chapter 1. The Silent Failure of Classical Technical Analysis
- The mental model we were taught — and its founding flaw
- The illusion of visual control
- Why institutions don’t trade what you trade
- The final fracture: when support stops being support
- The disciplined trader who doesn’t progress
-
Chapter 2. The Market as an Auction: The Missing Piece
- The microstructure the chart hides
- What actually moves price: passive orders and aggressive orders
- How a Footprint is built — the X-ray of the auction
- Why a breakout doesn’t mean anything by itself
- How your reading changes once you understand the auction
-
Chapter 3. Three Layers: The Book's Core Decision Model
- Layer 1 — The session narrative: what the market is trying to do today
- Layer 2 — Structure: where it makes sense to act
- Layer 3 — The Footprint’s micro-confirmation
- The universal mistake: trading Layer 3 without context
- How a professional trader makes decisions
-
Chapter 4. The Session Narrative: Reading What the Market Is Trying to Do
- Phases of the intraday auction and their transitions
- The Initial Balance as the day’s thermometer
- Trend days, rotational days, and no-opportunity days
- How to build a hypothesis before the market opens
- What invalidates a hypothesis, and when to abandon it
-
Chapter 5. The Map: The Levels That Matter Before You Look at the Footprint
- Volume profile: session vs. composite
- Macro institutional levels: Settlement, PDH/PDL, VWAP, ONH/ONL, Weekly H/L
- High-value institutional zones: confluence and hierarchy
- When the Footprint is signal and when it’s noise
- Building the trading plan before the market opens
What you take away from these pages
Why a support level that looked solid gives way, and why a clean breakout reverses: the limit of classical technical analysis lies in the information the chart leaves out.
What moves price. Passive orders set the level and aggressive orders consume it; the footprint records that collision at every price, and the diagonal comparison between bid and ask is what makes it readable.
The decision model at the core of the book: session narrative, structure and footprint confirmation, in that order. Trading the third layer without the first two is the mistake the rest of the book tries to prevent.
How to read the session before looking at the flow: the phases of the intraday auction, the Initial Balance, trend, rotational and no-opportunity days, and what invalidates a hypothesis.
How to build the map of levels: session and composite profiles, Settlement, the previous day's high and low, VWAP and overnight levels, and when what shows up on the footprint is signal and when it is noise.
Three figures from the sample
The book's charts are diagrams designed by the author to explain the mechanics. Prices sit in NQ's range, but they do not reproduce any specific real session.
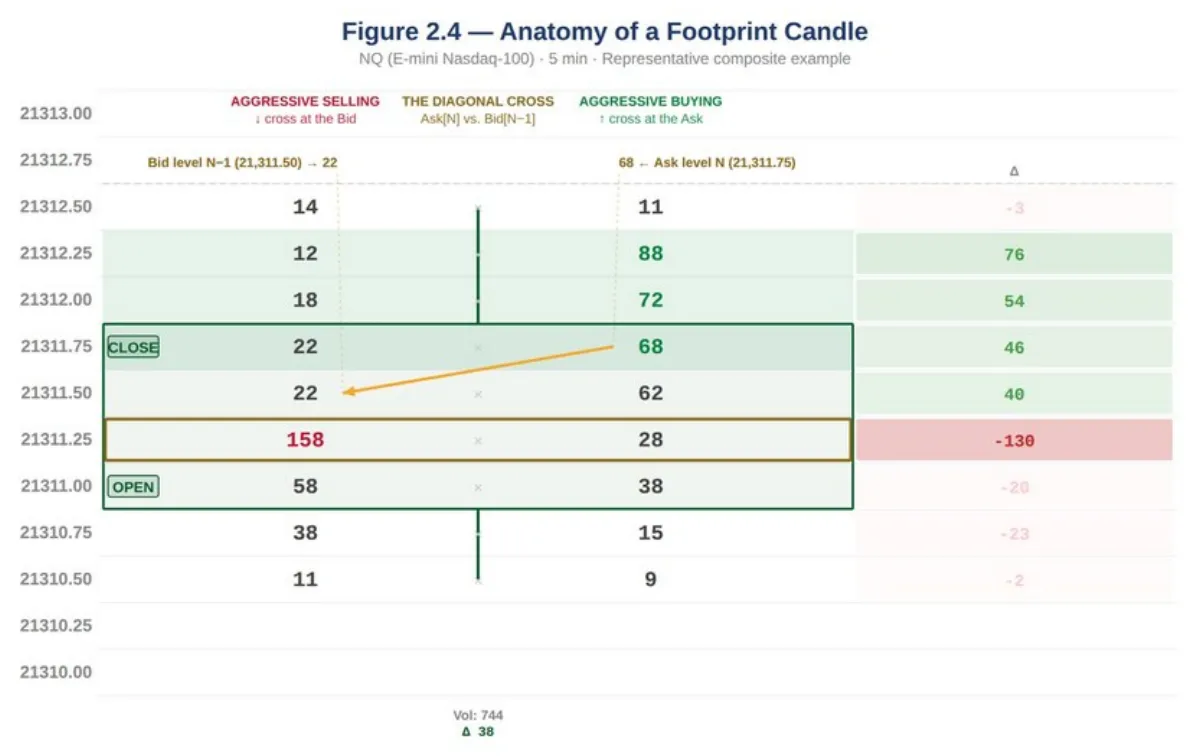
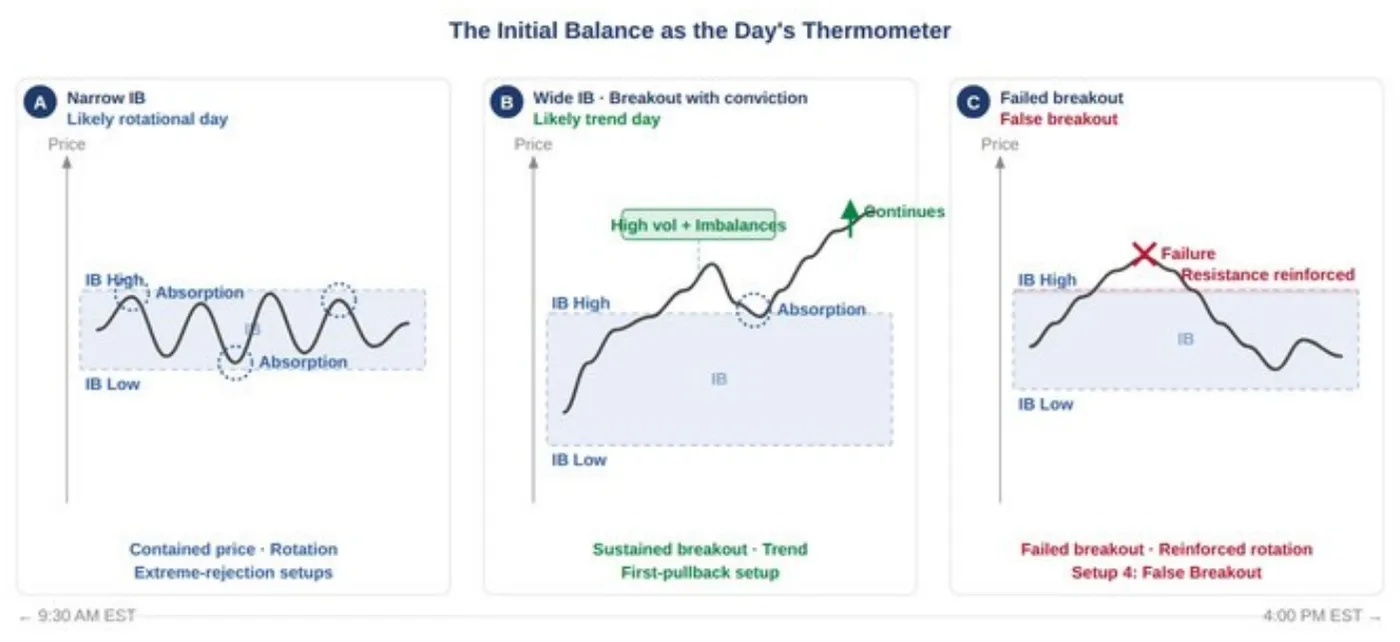
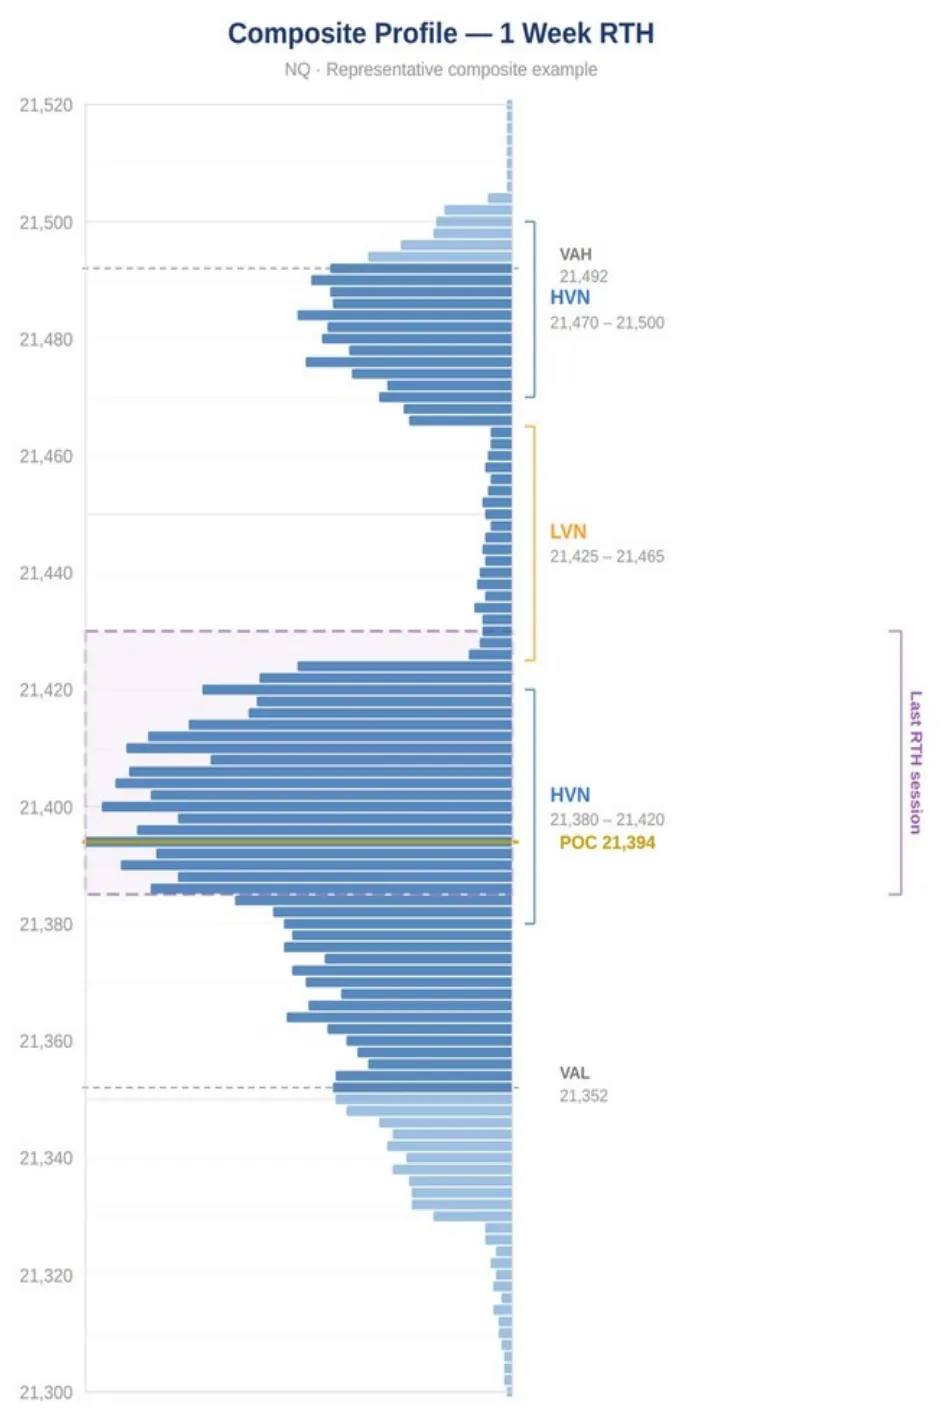
Who it is for
For traders who already use technical analysis, know intraday trading, and want to understand why price stops where it stops. It is not an introduction to trading. The sample lets you check, before buying, whether the level and the approach suit you.
What you will not find
There are no promises of profit and no win rates. The final part of the book is devoted entirely to what flow analysis cannot give you.
What the full book adds
The sample ends where confirmation begins. From chapter 6 onwards the book develops the tools for reading the flow (delta, absorption, CVD, imbalances), volume and liquidity in high-volatility conditions, the nine setups from context to invalidation, the separation between researching, executing and auditing, the psychological side of the footprint, the costliest mistakes, and the real limits of the method. It closes with a microstructure glossary and pre-session and post-session checklists.